

- Offer Profile
- MR is a set of tools that
implements multiscale methods for processing 1D signals, 2D images, and 3D
data volumes.
What MR multiresolution analysis software offers- Scale and Resolution
- Image and Data Analysis
- Extensive Signal and Noise Modeling
- Innovation and Performance
- Financial Modelling, Nowcasting, Prediction
- Wavelet and multiresolution transforms, ridgelet and curvelet transforms
Description
- MR is a set of software components developed by CEA (Saclay,
France) and Nice Observatory. This project originated in astronomy, and
involved the development of a range of innovative methods built around
multiscale analysis. The MR software components include almost all
applications presented in the book Image and Data Analysis: the Multiscale
Approach . Descriptions of these applications can also be found in many
published papers. The goal of MR is not to replace existing image processing
packages, but to complement them, offering the user a complete set of
multiresolution tools. These tools are executable programs, which work on a
wide range of platforms, independently of current image processing systems.
They allow the user to perform various tasks using multiresolution, such as
wavelet transforms, filtering, deconvolution, and so on. Programs can also
be called from a Java interface. A set of IDL (Interactive Data Language, by
Research Systems Inc.) and PV-Wave (Visual Numerics Inc.) routines are
included in the package which interface the executables to these image
processing packages. MR is an important package, introducing front-line
methods to scientists in the physical, space and medical domains among other
fields; to engineers in such disciplines as geology and electrical
engineering; and to financial engineers and those in other fields requiring
control and analysis of large quantities of noisy data.
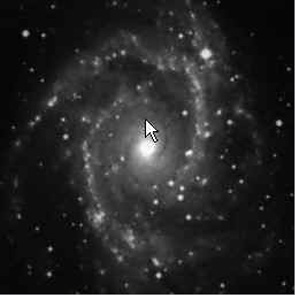
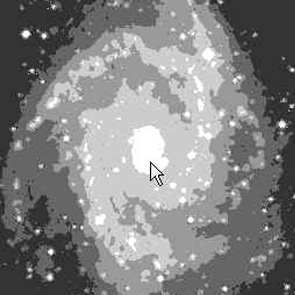
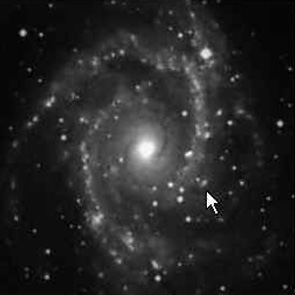
Wavelets and other multiresolution techniques have been developed in recent years, and furnish a powerful and insightful representation of the data. By means of multiresolution or multiscale analysis, an image can be decomposed into a set of images (or scales), each scale containing only structures of a given size. This data representation, associated with noise modeling, has been applied to very different applications such as data filtering, deconvolution, compression, object detection, and so on. Results are enhanced in all such processing because the wavelet transform approach allows a better understanding of how the data values are distributed in an image, and how the signal can be separated from the noise. The goal of this project is develop new methods for data processing using the multiscale approch. Several products, MR/1 , MR/2 , MR/3 ,and MR/4 have been realized.
MR/1: Multiresolution and Applications
- MR/1 is a set of software components developed by CEA
(Saclay, France) and Nice Observatory. This project originated in astronomy,
and involved the development of a range of innovative methods built around
multiscale analysis. The MR/1 software components include almost all
applications presented in the book Image and Data Analysis: the Multiscale
Approach . Descriptions of these applications can also be found in many
published papers . The goal of MR/1 is not to replace existing image
processing packages, but to complement them, offering the user a complete
set of multiresolution tools. These tools are executable programs, which
work on a wide range of platforms, independently of current image processing
systems. They allow the user to perform various tasks using multiresolution,
such as wavelet transforms, filtering, deconvolution, and so on. Programs
can also be called from a JAVA interface. A set of IDL (Interactive Data
Language, by Research Systems Inc.) and PV-Wave (Visual Numerics Inc.)
routines are included in the package which interface the executables to
these image processing packages. MR/1 is an important package, introducing
front-line methods to scientists in the physical, space and medical domains
among other fields; to engineers in such disciplines as geology and
electrical engineering; and to financial engineers and those in other fields
requiring control and analysis of large quantities of noisy data.
Wavelet and Multiscale Transform
Many 1D and 2D wavelet transforms and other multiscale methods, such the Pyramidal Median Transform or the lifting scheme, have been inplemented in MR/1 .
Noise Modeling:
-
- Our noise modeling in the wavelet space is based on the assumption that the noise in the data follows a distribution law, which can be:
- a Gaussian distribution
- a Poisson distribution
- a Poisson + Gaussian distribution (noise in CCD detectors)
- Poisson noise with few events (galaxy counts, X-ray images, point patterns)
- Speckle noise
- Correlated noise
- Root Mean Square map: we have a noise standard deviation of each data
value.
- it is stationary, and we have a subimage containing a realization of the noise,
- it is additive, and non-stationary,
- it is multiplicative and stationary,
- it is multiplicative, but non-stationary,
- it is undefined but stationary,
- it is additive, stationary, and correlated.
Applications:
- 1. Descriptions of these
applications can also be found in many published papers .
2. General tools: data conversion, simulation, statistic, Fourier analysis, mathematical morphology, principal component analysis, ...
3. 1D and 2D wavelet transform and reconstruction..Multiscale object manipulation: statistic, band extraction, comparison, ...
4. Multiresolution support detection.
5. 1D and 2D filtering taking into account the different noise models. Many methods have been implemented (11 in 1D and 18 in 2D) including standards like K
Sigma thresholding, SURE, MAD, Universal thresholding, Multiscale Wiener filtering, ...
6. Image background subtraction.
7. Image deconvolution: nine standard deconvolution methods are available (MEM, LUCY, Landweber, MAP, ...), and five wavelet based methods.
8. Image registration.
9. Lossy and lossless image compression. the PMT (median based compression method) and the bi-orthogonal wavelet transform allows both the user to
reconstruct an image (or a part of an image) at a given resolution. Lossless image compression is based on the lifting scheme.
10. Object detection and extraction in 1D and 2D data set using the Multiscale Vision Model.
11. Edge detection and image reconstruction from the multiscale edges. Many standard edge detection methods are available (15) and two wavelet based methods.
12. Contrast enhancement. Standard methods and contrast enhancement methods based on the wavelet transform are available.
13. 1D Wavelet Transform Modulus Maxima (WTMM) representation and reconstruction.
14. 1D Multifractal analysis.
15. Time-Frequency analysis (Short Term Fourier Transform, Wigner-Ville transform).
16. Time series nowcasting and forecasting.
MR/2: Multiscale Entropy and Applications
- The term "entropy" is due to Clausius (1865), and the
concept of entropy was introduced by Boltzmann into statistical mechanics,
in order to measure the number of microscopic ways that a given macroscopic
state can be realized. Shannon (1948) founded the mathematical theory of
communication when he suggested that the information gained in a measurement
depends on the number of possible outcomes out of which one is realized.
Shannon also suggested that the entropy can be used for maximization of the
bits transferred under a quality constraint. Jaynes (1957) proposed to use
the entropy measure for radio interferometric image deconvolution, in order
to select between a set of possible solutions that which contains the
minimum of information, or following his entropy definition, that which has
maximum entropy. In principle, the solution verifying such a condition
should be the most reliable. Much work has been carried out in the last 30
years on the use of entropy for the general problem of data filtering and
deconvolution. Traditionally information and entropy are determined from
events and the probability of their occurrence. Signal and noise are basic
building-blocks of signal and data analysis in the physical and
communication sciences. Instead of the probability of an event, we are led
to consider the probabilities of our data being either signal or noise.
Consider any data signal with interpretative value. Now consider a uniform
"scrambling" of the same data signal. (Starck et al., 1998, illustrate this
with the widely-used Lena test image.) Any traditional definition of
entropy, the main idea of which is to establish a relation between the
received information and the probability of the observed event, would give
the same entropy for these two cases. A good definition of entropy should
instead satisfy the following criteria:
- 1.The information in a flat signal is zero.
- 2.The amount of information in a signal is independent of the background.
- 3.The amount of information is dependent on the noise. A given signal Y (Y = X + Noise) doesn't furnish the same information if the noise is high or small.
- 4.The entropy must work in the same way for a signal value which has a value B + epsilon (B being the background), and for a signal value which has a value B - epsilon.
- 5.The amount of information is dependent on the correlation in the signal. If a signal S presents large features above the noise, it contains a lot of information. By generating a new set of data from S, by randomly taking the values in S, the large features will evidently disappear, and this new signal will contain less information. But the data values will be the same as in S.
MR/3: 3D and Multichannel Data
- MR/3 deals with the analysis of multi-channel data or
3D data.
3D data can either be a real cube, or a set of images of the same observation, but taken at different times. Multi-channel data can be either 1D or 2D multi-channel:- 1D multi-channel: a 1D signal is observed at several wavelength or at different times. The result is an image.
- 2D multi-channel: a 2D signal (image) is observed at several
wavelengths or at different times. The result is a cube. A special case
of multi-channel images is color images. In this case, we have three
channels. Several color coordinate systems exist. The most widely-used
is the RGB system. Each pixel is identified by three values R, G, and B
corresponding to the three colors red, green, and blue. Applications in
MR/3 are
1. General tools: statistic, operations, noise simulation, conversion ....
2. Cube and Wavelet transform-
1. 3D a trous wavelet transform and reconstruction.
2. 3D bi-orthogonal wavelet transform and reconstruction.
3. 3D Wavelet transform manipulation (band extraction, ...).
4. 3D data filtering using the wavelet transform.-
1. 1D and 2D Wavelet Karhunen-Loeve transform (WT-KLT) and reconstruction.
2, 1D and 2D multichannel data filtering using the WT-KLT.
3. Independent Component Analysis.-
1 .RGB image compression.
2. RGB image filtering.
3. RGB image contrast enhancement.-
1. Images coaddition taking into account vertical and horizontal shifts.
2. Images deconvolution taking into account vertical and horizontal shifts.
MR/4: Ridgelet and Curvelet
- MR/4 deals with the ridgelet and the curvelet
transforms.
Wavelets presents some limitations when the data present anisotropic features. New methods, such the ridgelet transform and the curvelet transform, are better adapted to this kind of data. Wavelets, Ridgelets and Curvelets can also be combined in order to benefit of the advantages of each of them.
Applications in MR/4 are
General tools: statistic, operations, noise simulation, conversion ....
1. 2D Ridgelet:- 1. Ridgelet transform and reconstruction of images.
2. Statistics relative to ridgelet coefficients.
3 Image Ridgelet filtering.2. 2D Curvelet:
- 1. Curvelet transform and reconstruction of images.
2. Statistics relative to curvelets coefficients.
3. Curvelet filtering.
4. Contrast enhancement by the Curvelet transform.3. Color images and Curvelets:
- 1. RGB image contrast enhancement by the Curvelet transform.
2. RGB image Curvelet filtering.4. Combined Filtering Method.
Sparse Image and Signal processing
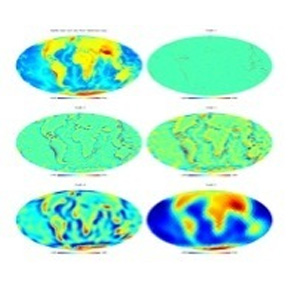
Pyramidal Wavelet Transform on the Sphere
- The global relief data are ETOPO5 land and sea-floor elevation data. The isotropic pyramidal wavelet transform preserves detail, and is efficient in storage and computation. Chapter 10 discusses many aspects of multiscale geometric analysis on the sphere.
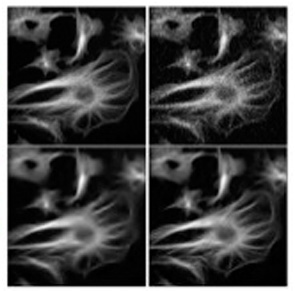
Filtering Biomedical Microscope Images
- The image (upper left) is of fluorescent tubulin filaments. Upper right then is a noisy version, with Poisson noise. The lower images are filtered, as discussed in Chapter 6. This noise filtering is based on the curvelet transform for preservation of faint features.
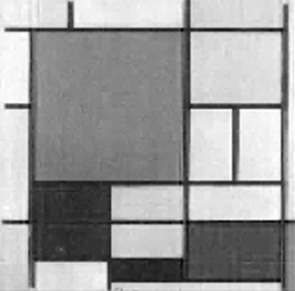
Signal Recovery from Compressed Sampling
- Compressed sensing simultaneously samples and compresses the signal. The image of Piet Mondrian's painting is an example used in Chapter 11 to show how compressed sensing handles acquisition and transmission of large amounts of image data.